Key numbers
About Amador Water Agency
Following the California Gold Rush, pioneer entrepreneurs built canals and reservoirs designed to move Mokelumne River water from the Sierras to the Amador mines to power their stamp mills. Those canals became the foundation of water service in Amador County.
In 1959, the Amador County Water Agency was formed as a public non-profit special district by the California Legislature and ratified by the voters of Amador County for the purpose of providing water, wastewater and storm drain services to Amador County.
In 1985 the Agency purchased the Amador Water System from Pacific Gas & Electric. Several more water and wastewater improvement districts have since elected to become part of the Agency.
In 1995, the Agency changed its name to the Amador Water Agency, to more clearly demonstrate that it operates independently from Amador County government.
Serving approximately 10,000 customers in Amador County today, the Agency is the primary provider of drinking water. In addition to residents and businesses in unincorporated areas, the Agency sells water to the cities of Ione, Jackson, Plymouth, Sutter Creek, Amador City and several special districts.
Case study participants
Tanner hydroelectric
The Tanner hydroelectric station site is located at the Tanner Reservoir dam (“Raw Bowl”) located adjacent to the Tanner Water Treatment Plant (WTP) near the Amador Water Agency main office. The water source is the Amador Transmission Pipeline (ATP) that begins at Lake Tabeaud and terminates at a pressure reducing station (PRS) on the crest of the dam. The ATP supplies raw water to the Tanner Reservoir (Raw Bowl) and the Tanner WTP via the PRS, where the hydropower facility is located (Figure 1). The ATP was completed in 2008 to replace the historic ditch and flume system. The ATP size varies from 20-inch to 30-inch, but the diameter at its terminus at the PRS is 20 inches. The pipeline has a maximum capacity of approximately 33 cubic feet per second (cfs). Current flow rates vary during normal operation between 3.5 cfs and 14 cfs, as depicted in Figure 2. Pressure test data indicates at static conditions the ATP holds 108 psi pressure at the PRS. According to a test report graph provided by AWA, the pressure drops to 65 psi at 18.5 cfs at the PRS. The differential head at this site is about 150 – 200 ft.
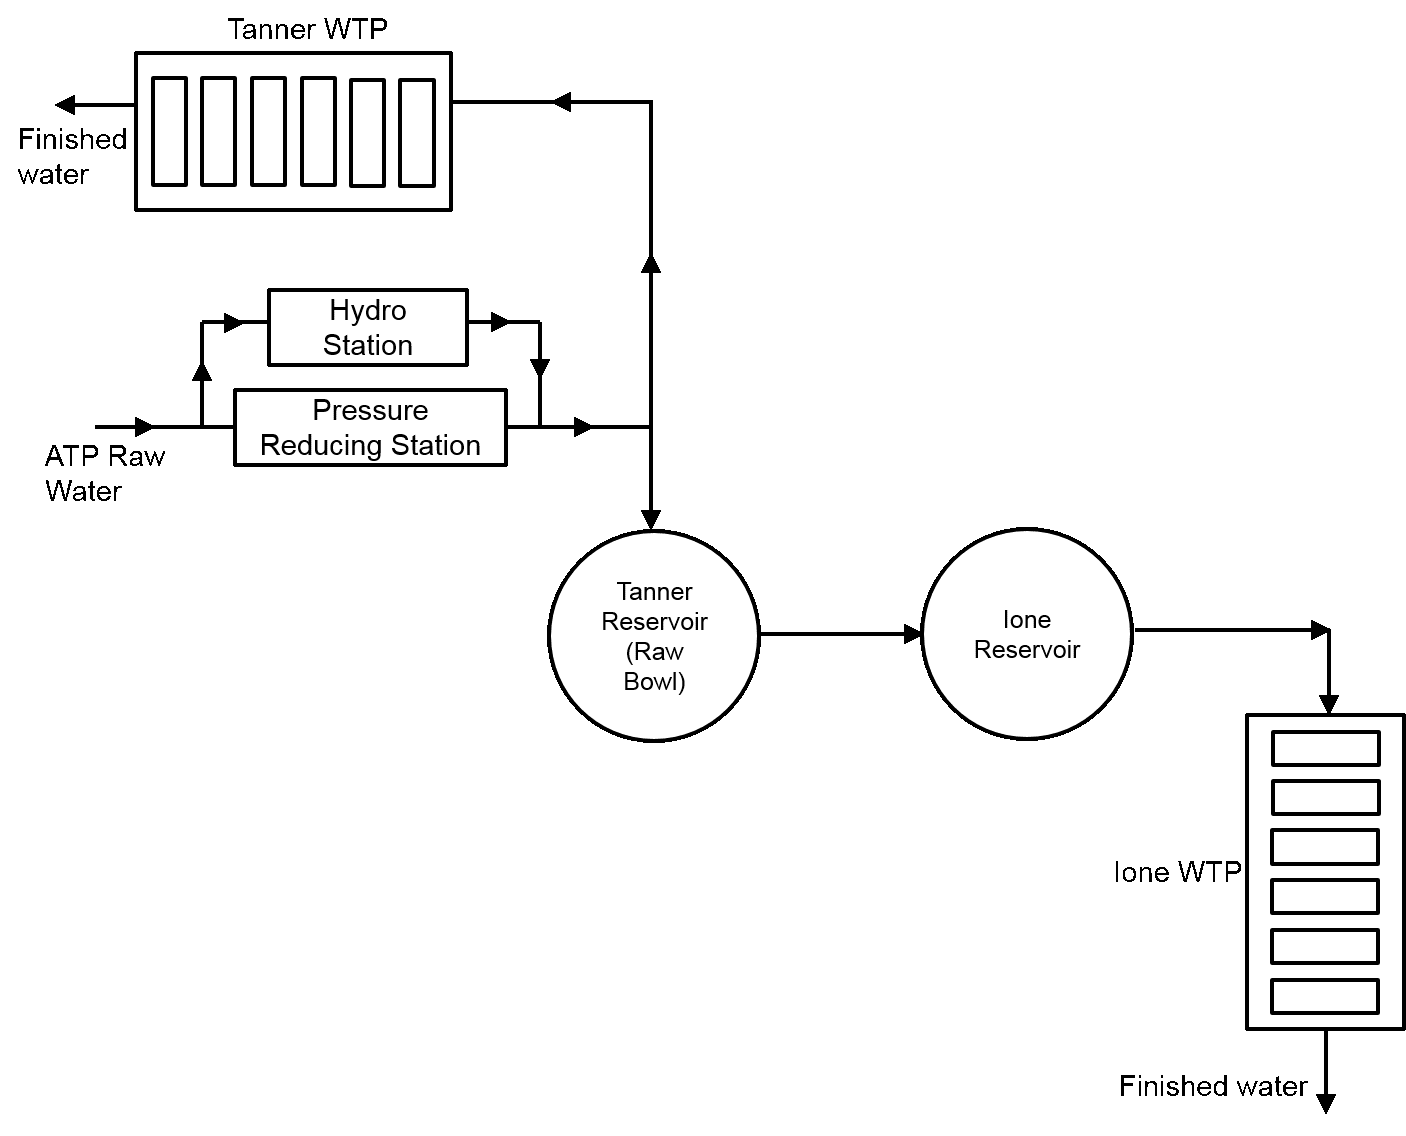
Figure 1. Amador Transmission Pipeline (ATP) flow diagram
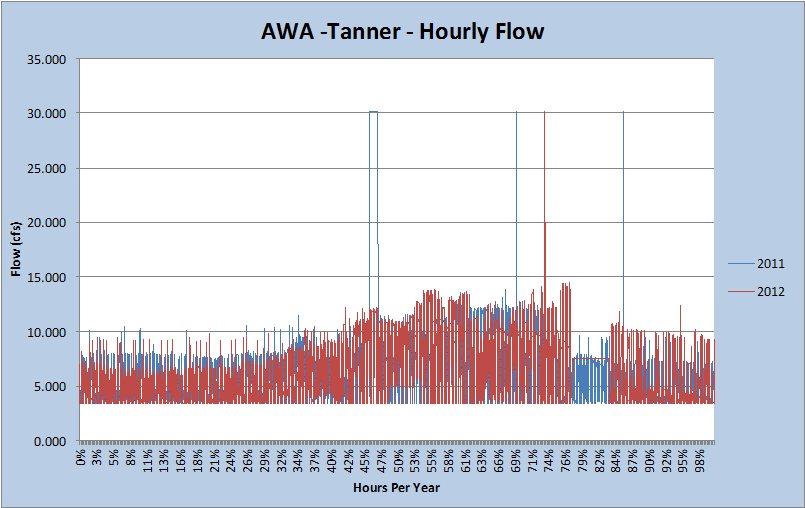
Figure 2. Flow profiles at the Tanner’s pressure reducing station (PRS) in 2011 and 2012
The Tanner hydropower station consists of two pump-as-turbine (PAT) units with total capacity of 110 kW (one operates at 3 cfs, and the other at 7 cfs maximum). All the generated energy is exported to the grid and AWA receives credit based on the energy consumption in the facility at the same tariff as what they would have paid. However, AWA is able to combine several existing meters on a contiguous property to use to offset the generation of the hydro project, i.e. Net Energy Metering Aggregation (NEMA). The estimated annual generation capacity at this site is 580,475 kWh. However, currently Tanner hydro station is only generating about 70% of its full capacity due to the complex mode of operation required by the downstream Tanner WTP that impacts the pressure and flow to the turbine systems.
Project drivers
AWA is one of the many utilities in California that has long expressed interest in incorporating renewable energy in their water distribution systems. Solar energy was initially considered, however, the significant number of pressure zones in the service area makes hydropower to be more economically attractive. The elevation in the service area can go from 300 ft up to 4000 ft, or even up to 7000 – 8000 ft at certain county areas. Due to this high elevation, there is also a system of pressure reducing stations (PRS) in the service area, which are recognized as energy harvesting spots by AWA. During the initial feasibility assessment in 2013, two locations were identified: pressure reducing stations at Tanner WTP and Ione WTP. The head difference in Tanner site is significantly lower than Ione site (200 ft compared to 3.3980 ft), however, the flow through the site is constant and quite substantial compared to Ione site (3.3 – 10 cfs compared to 1 – 4 cfs). Following thorough economic, environmental, technical and regulatory assessment, the Tanner site was considered to have a better return on investment (ROI) at that time and thus the board decided to conduct the first project at Tanner site. This site was also eligible for Self-Generation Incentive Program (SGIP) sponsored by California Public Utility Commission (CPUC).
Feasibility Assessment
AWA authorized NLine Energy to develop a feasibility assessment on the potential Tanner Hydro project, which was completed in January 2013. NLine Energy analyzed the historical pressure and flows of the site and determined that a two pump as turbine system with a nameplate rating of 110 kW was the best option for the site. The available flow at this site currently ranges from 3.5 cfs to 14 cfs while the net head ranges from 130 ft to 210 ft. Due to future water demand the Tanner Water Treatment Plant is expected to expand as high as 14 cfs. The feasibility assessment determined that the project would cost approximately $1,400,000, would generate 580,000 kilowatt hours annually and would have a 13-year payback. Figure 3 provides an overview of the project site. After conducting the feasibility assessment, AWA proceeded to complete 100% design in March 2015, and finally received the permission to operate in June 2016. It took approximately 2.5 years to complete the project, as depicted by Figure 4 below.
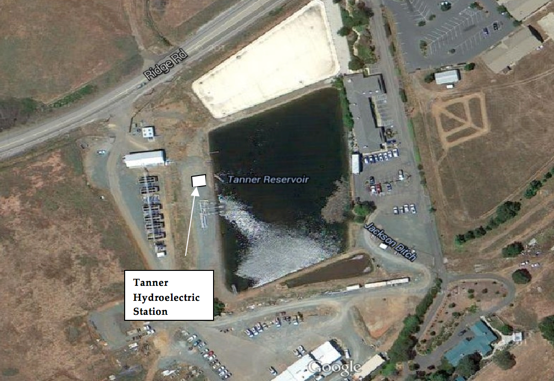
Figure 3. Location of Tanner hydroelectric station (left image)
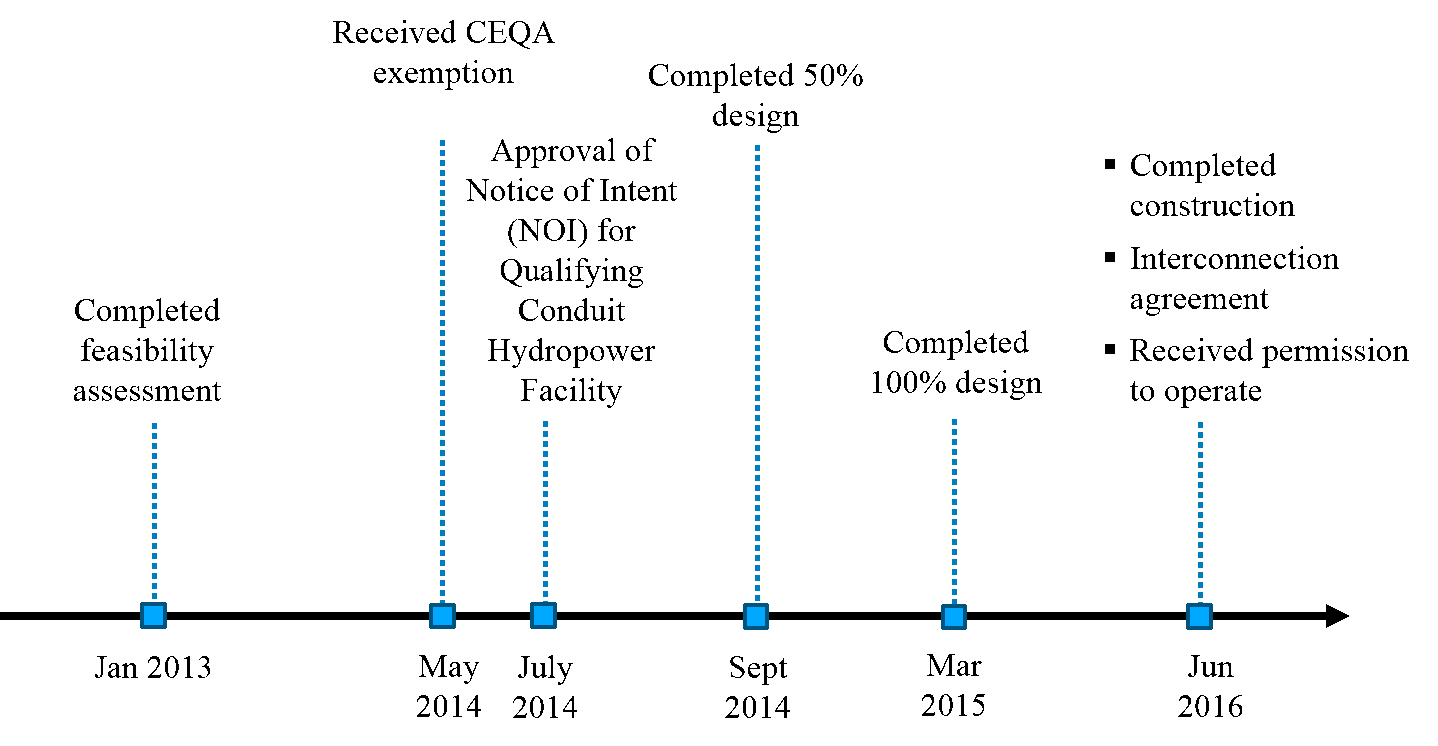
Figure 4. The timeline of the project starting from feasibility assessment to operation startup
Permitting and Regulation
California Environmental Quality Act (CEQA)
The California Environmental Quality Act (CEQA) allows a Class 28 Exemption for small hydroelectric projects. Section 15328, titled, “Small Hydroelectric Projects at Existing Facilities”. This project qualified for the CEQA exemption. AWA received CEQA exemption in May 2014, as shown in Figure 4 above.
FERC Conduit Exemption
Under the Federal Power Act (FPA), FERC regulates the nation’s non-federal hydropower resources. Before August 2013, FERC issues three types of development authorizations: conduit exemptions, five-megawatt (MW) exemptions, and licenses. However, when “Hydropower Regulatory Efficiency Act” was signed in August 2013, there was a significant simplification in small hydropower regulatory processes. One regulation that is especially attractive for small hydropower projects is the elimination of exemption and licensing requirement for hydropower facilities located on non-federally owned conduits with installed capacity of 5 MW or less. The applicant must only file a Notice of Intent (NOI) to Construct a Qualifying Conduit Hydropower Facility with FERC as well as show that the conduit is not used primarily for electricity generation and was not licensed or exempted on and before August 9, 2013. The criteria for a Qualifying Conduit Hydropower Facility is listed in Table 1 below.
Table 1. Criteria for a Qualifying Conduit Hydropower Facility (FERC 2017)
| Statutory provision | Description |
| FPA 30(a)(3)(A), as amended by HREA | The conduit the facility uses is a tunnel, canal, pipeline, aqueduct, flume, ditch, or similar manmade water conveyance that is operated for the distribution of water for agricultural, municipal, or industrial consumption and not primarily for the generation of electricity |
| FPA 30(a)(3)(C)(i), as amended by HREA | The facility is constructed, operated, or maintained for the generation of electric power and uses for such generation only the hydroelectric potential of a non-federally owned conduit |
| FPA 30(a)(3)(C)(ii), as amended by HREA | The facility has an installed capacity that does not exceed 5 megawatts |
| FPA 30(a)(3)(C)(iii), as amended by HREA | On or before August 9, 2013, the facility is not licensed, or exempted from the licensing requirements of Part I of the FPA |
The NOI process is generally much faster than exemption process, as the facility does not require to hold a public hearing. The NOI process takes around 45 days to complete. The Tanner hydro station met all the criteria listed above and in July 2014, the NOI was approved by FERC.
Design and Construction
The new Tanner Hydroelectric Station (hydro) operates in parallel with the Tanner Pressure Reducing Station (PRS). A pipeline taps into the high-pressure side of the Tanner PRS (upstream of the 16-inch Singer valve) and is routed to the new powerhouse (Figure 5).

Figure 5. Schematic flow diagram of the hydroelectric unit at Tanner Water Treatment Plant
Based on the head and flow conditions for this site, the Cornell Pump-as Turbine (PAT) technology was implemented at this site. PAT machines operate best at optimum design conditions and have a relatively narrow efficiency curve. A PAT operates best at a single flow and head and generally do not operate well below approximately 80 percent of full flow. For maximum flexibility and to capture as much flow as possible, two PAT units were implemented. The PAT units receive the high-pressure water and discharge into a new discharge header near the low pressure side of the existing PRS. The hydroelectric system consists of two Cornell Pump-as Turbines with a total nameplate rating of 110kW. The PAT system consists of a Cornell PAT 4TR2 rated for approximately 3 cfs/150 ft of net head and a Cornell PAT 6TR2 rated for approximately 7 cfs/200 ft of net head. The efficiency curves for the two turbines are included in Figure 6 below.
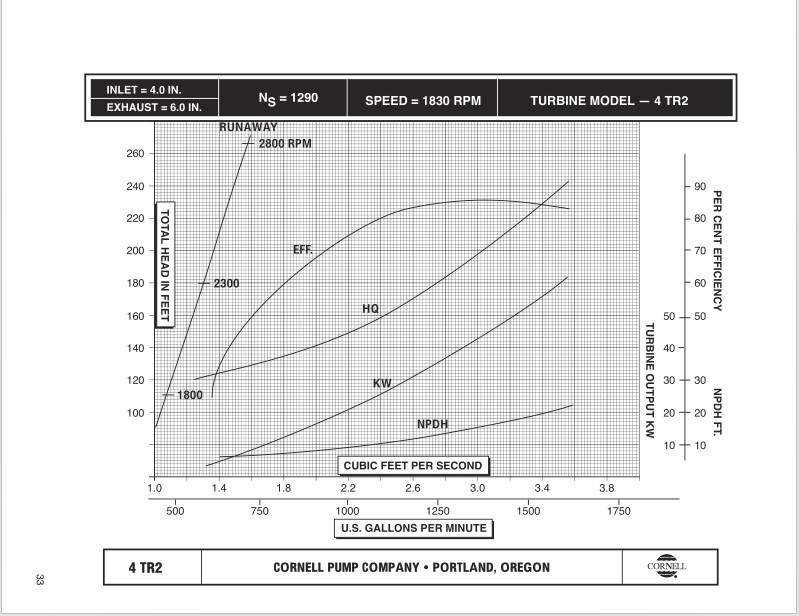
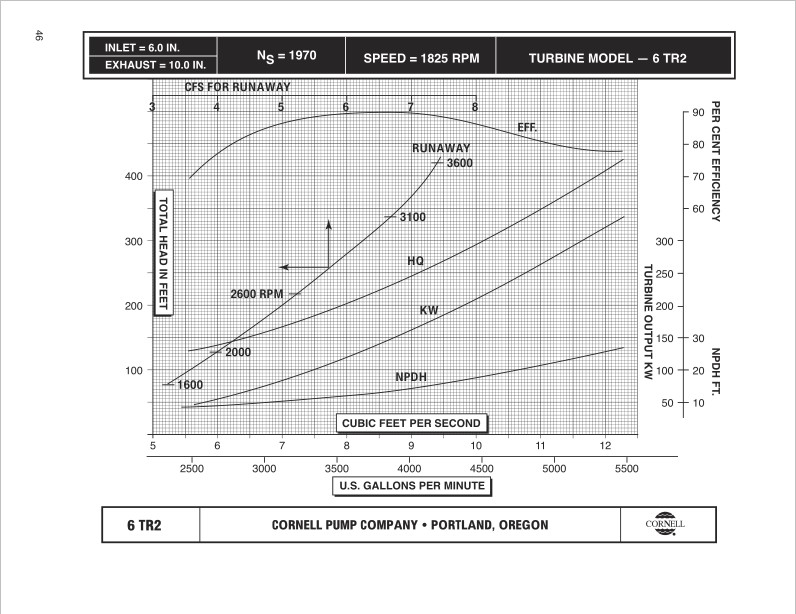
Figure 6. Pump-as turbine efficiency curves
The powerhouse is approximately 580 square feet in size. The building is prefabricated steel with sound attenuation. The powerhouse is supplied from an existing 20-inch connection off the ATL. A new 16-inch pipe supplies water to the new powerhouse. From the powerhouse a 16-inch pipe connects to the existing 16-inch supply pipeline to the Tanner WTP and the Tanner Raw Bowl.
One notable challenge during the design process was the development of a customized Program Logic Controller (PLC) system that can handle various complex operational scenarios. The complex scenarios mainly arise from the fact that the hydro station feeds water to the Tanner Water Treatment Plant and a raw water reservoir. In addition, since the hydro station is located upstream of the Tanner WTP, a minimum pressure must be maintained to serve the WTP. This required pressure also changes constantly, especially during the backwashing period in WTP. During the design stage, the PLC developer (Tesco) worked closely with the AWA operators to simulate possible scenarios that can occur in the downstream WTP and to ensure that the program developed can handle those scenarios.
Operations and Maintenance
The Tanner Hydroelectric Station (hydro) is operating in parallel with the Tanner PRS. Using a pipeline installed on the high-pressure side of the Tanner PRS (upstream of the 16-inch Singer valve), the two PAT units receive the high-pressure water and discharge into a new discharge header near the low pressure side of the existing PRS. Similar with PRS, the hydropower systems reduce the pressure by utilizing the pressure and flow to convert hydraulic energy into mechanical energy. The driving head required for the WTP creates a back-pressure on the turbines so that a downstream pressure control valve is not necessary. However, the control valve on the Tanner Raw Bowl discharge side of the header has to maintain upstream pressure to a minimum of 8 psi in order to serve the Tanner WTP.
Due to the “on-off” nature of the Tanner WTP, the control header acts as the flow regulation for directing the discharge either to the Tanner WTP and/or into the Tanner Raw Bowl. This mode allows for the hydro to run continuously and the Tanner WTP to maintain its current on-off operation, with the Tanner Raw Bowl serving as the equalization basin. This mode of operation maintains a more constant flow in the ATP and greatly reduce surge in the ATP and extend its life as a result. It is important that during the on-off operation of the WTP that the hydropower plant to not be shut down, but continue to run. If the hydro shuts down, PG&E could charge the Agency with Demand Charges, which would reduce the overall financial income of the project. However, there will be times when the system will be off because the Tanner Raw Bowl and the clear well is full. These shutdown periods might be minimized by reducing the Tanner Raw Bowl operating target levels during low demand periods. As a result of this type of operation, the demand seen by the hydroelectric station will mimic closely the daily production of the Tanner and Ione WTPs, as opposed to the current meter readings recorded by the magnetic flow meter located just upstream of the Tanner PRS. Another issue during operation is the changing pressure requirement by downstream Tanner WTP due to backwashing. The changes in pressure requirement greatly affect the flow and pressure in the turbine system which affect its power generation capacity. AWA suspected that this issue might be the main cause of production loss which hindered the turbines to generate power at full capacity (currently the hydro station in average is producing 70% of its full capacity). The complex operation of Tanner WTP required a sophisticated program logic controller (PLC) system with well-trained personnel.
Typical maintenance of a hydroelectric station includes the following:
- Daily inspections of the hydroelectric station are recommended to detect leaks, excessive moisture buildup, loud noises, excessive vibration and/or heat. Sensors may be used to remotely detect many of these issues to augment physical inspections;
- Quarterly oil inspections / change: bearings, hydraulic systems, and gearboxes require grease or oil. Annual inspection and testing for viscosity, acidity and water content are required, while minimizing different types of oil, if possible. If oil temperatures stay below 60˚C, the oil’s useful life is extended dramatically;
- Flow, pressure, and resulting kW production and overall efficiency should be checked periodically and instruments calibrated on regular intervals;
- The first inspection of the turbine itself should be at 12 months or 8,000 hours of operation;
- General inspections should occur every year until a history is established and trends are identified. Then the interval can be extended to two or more years. Similar installations may be good indicators of maintenance trends;
- Annual maintenance costs are assumed to be approximately $6,000 per year;
- Summary of annual maintenance and repair downtime:
-
- i. Assume one week each year,
- ii. Assume three weeks every five years,
- iii.Three months every 25 years
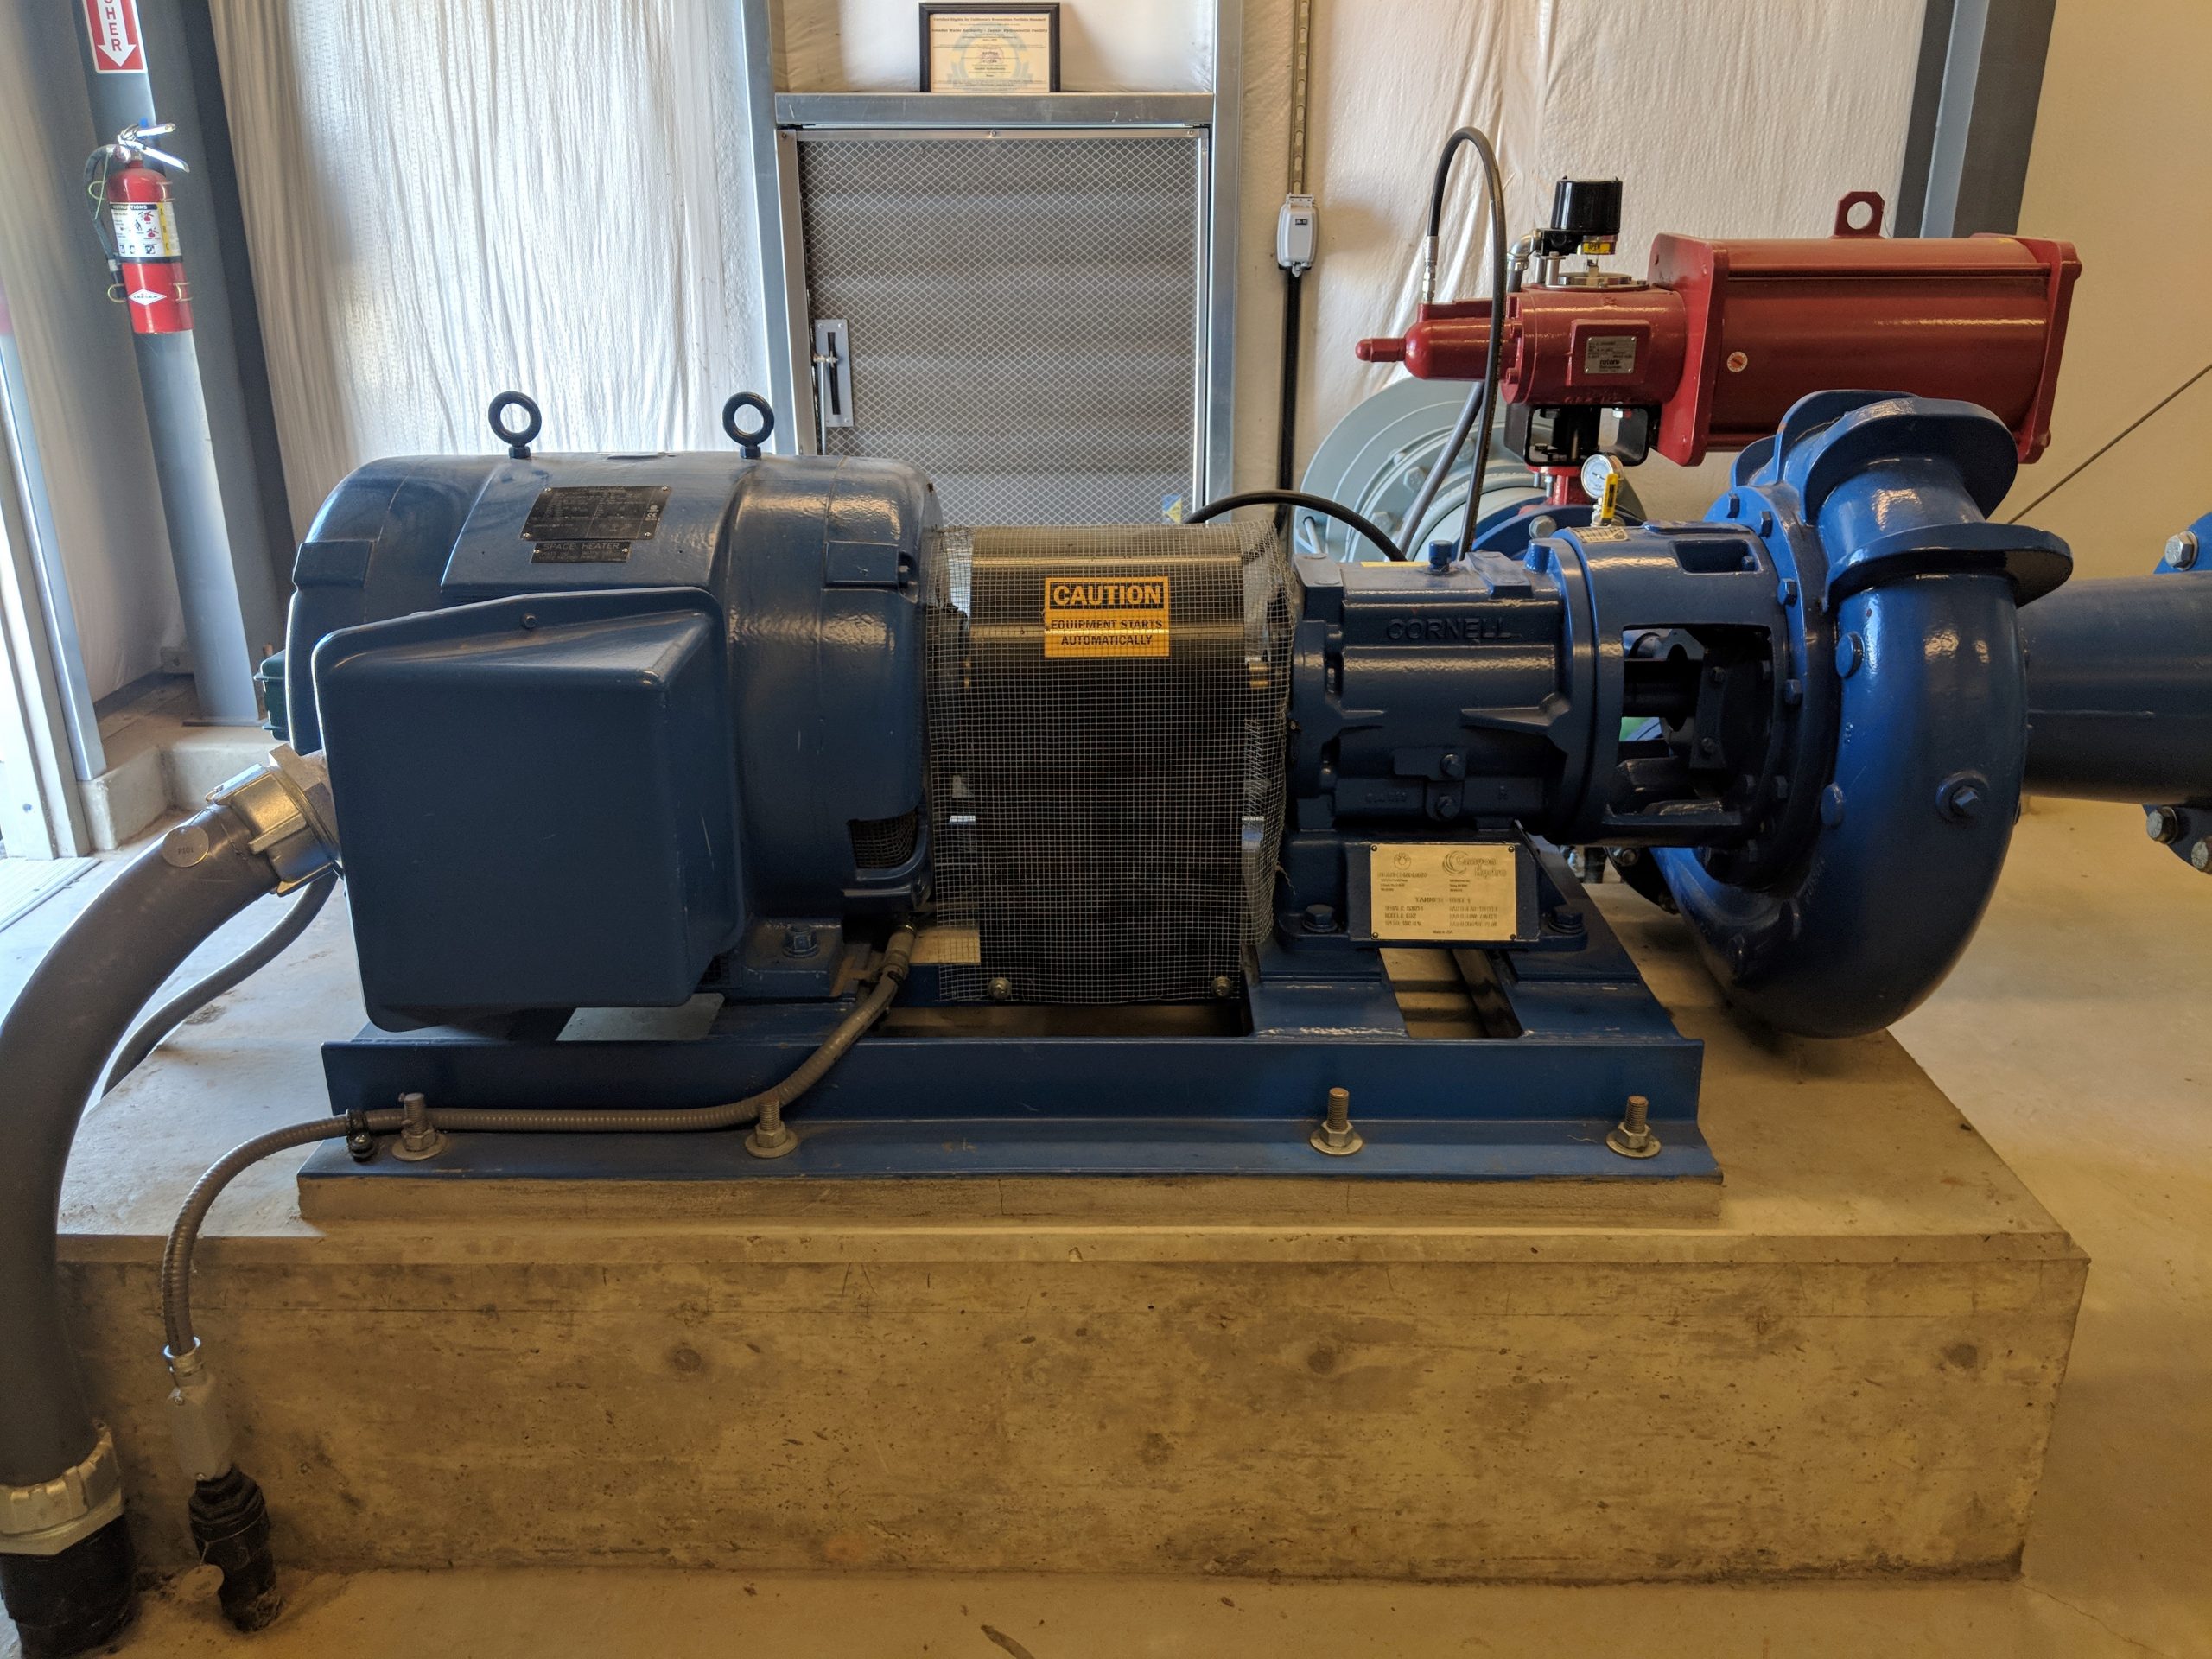
Figure 7. A photograph of one of the PAT units in Tanner hydroelectric station
Costs and Financing
An overview of the project cost estimated at three different times (preliminary, 50% design and after 100% design) is provided in Table 2 below. As can be seen, the project cost after 100% design only increased by less than 6% of the original estimation at preliminary stage. The small increase in the budget was mostly due to tight control from the board that required multiple financial assessment at different stages. This strategy was shown to be effective in making sure that the project budget did not stray too far from the original estimation..
Table 2. Overview of the project cost calculated in January 2013 (preliminary stage), September 2014 (50% design) and June 2015 (after 100% design)
| Cost item | Jan 2013 | Sept 2014 | June 2015 |
| Estimated Project Costs | $1,423,000 | $1,595,000 | $1,504,000 |
| Self-generation Incentive Program | $128,000 | $140,000 | $133,750 |
| Net Project Cost (Less Incentives) | $1,295,000 | $1,455,000 | $1,370,250 |
| Annual O & M Costs | $6,000 | $6,000 | $6,000 |
| 30-year Net Savings | $2,293,000 | $2,620,000 | $3,960,000 |
| 30-year NPV | $703,000 | $982,000 | $1,684,000 |
| Payback | 19.2 years | 17.7 years | 13.6 years |
Future Planning
The Tanner WTP has a maximum day treatment capacity of 4,800 gpm (10.7 cfs) utilizing six filters. Flow rates processed through the Tanner WTP vary from 0 cfs to approximately 7 cfs (3,140 gpm). An additional set of filters (No. 7 and No. 8) of similar design are scheduled for installation at some time in the future that will increase the capacity to 6,400 gpm (14.2 cfs). The increase in capacity is expected to increase the energy production in Tanner hydro station.
The Raw Bowl feeds the Ione Reservoir and subsequently the Ione WTP. The Raw Bowl holds 11.8 acre feet when full and the Ione Reservoir holds 26.9 acre-feet when full. The pipe connecting the Raw Bowl and the Ione Reservoir is the Ione Pipeline, which is a 16-inch Ductile Iron pipeline, 7.1 miles in length. The Ione WTP has a maximum day treatment capacity of 2,110 gpm (4.7 cfs) and an upgrade to the Ione WTP was recently completed. The Ione hydro station is currently in design stage.
Lessons Learned and Recommendations
- Interconnection cost: The Tanner Hydro Project was very small and implemented at the end of PG&E’s circuit, so it had minimal impact on PG&E’s system resulting in a low cost interconnection. Typically interconnection costs for small hydro projects cost hundreds of thousands of dollars but this project’s interconnection only cost approximately $2,500. Significant interconnection costs can be overwhelming for smaller projects, therefore identification and understanding of the impact of interconnection costs early in the process is imperative.
- Net metering: This was the first small hydro project in the state to utilize Net Energy Metering Aggregation (NEMA). NEM Aggregation enables the customer to combine several existing meters on a contiguous property to use to offset the generation of the hydro project.
- Control system: This hydro station feeds water separately to the Tanner Water Treatment Plant and a raw water reservoir, which necessitated complex programming and control logic. This type of programming can be very expensive and extend project timelines. Utilizing the same PLC developer that build the existing WTP facility also helps in reducing any confusion or error during the process as the developer is already familiar with the existing system.
- Future expansion plan: The Tanner Water Treatment Plant is expected to expand over time, which will increase the maximum water flow processed by the WTP as well as flow available to the hydro unit. Therefore this project implemented a set of turbines that can process existing flows but also is set up to process higher flows as the WTP expands in the future.

Andrew Benjamin, NLine Project Manager
Are you sitting on a source of wasted energy? Would you like to convert this into clean, renewable power? Give us a call! You’ll get a free assessment with an expert who can instantly identify your opportunity.

Are you sitting on a source of wasted energy? Would you like to convert this into clean, renewable power? Give us a call! You’ll get a free assessment with an expert who can instantly identify your opportunity.
Andrew Benjamin, NLine Project Manager

